- Home
- Introduction
- Downloads
- Example
-
User Guide
Index
 System requirement Installation Memory configuration, reducing memory usage Updating annotation databases Main user interface Data inputs Creating a project Annotating a project Using user annotation track [GFF3/BED] Analyzing a project Selecting genes or regions Exome or targeted capture sequencing A command line tool Version history Updating to the latest version FAQ Requests & discussions License
- Screenshot
- Java Dev
- Plug-ins
- Visitors
Using this software
0. For impatient users1. Data inputs
2. Create a project
3. Annotate a project
4. Filter for quality scores
5. Main user interface
6. SVA genome browser
7. SVA tables
8. Selecting genes or regions
9. Analysis
10. Exome or targeted capture sequencing
A command line tool
FAQ
Requests and discussions

The main interface of SVA
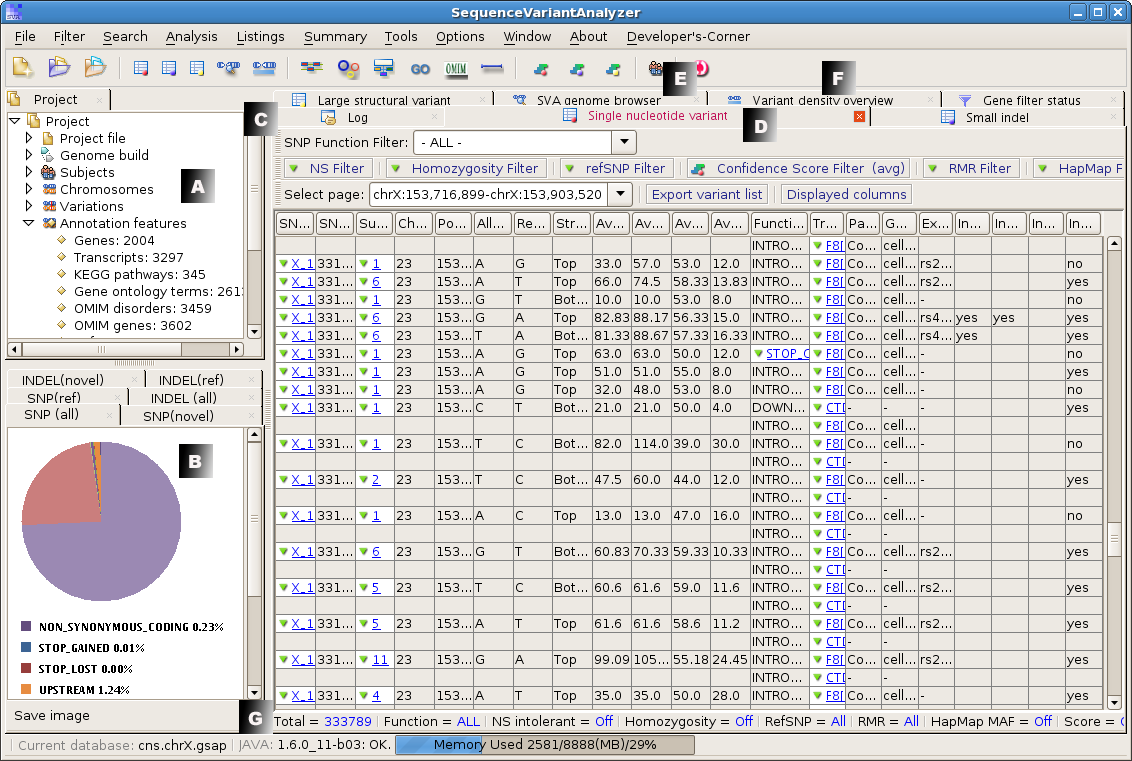
The main user interface of SVA is divided into several panels, as illustrated in the figure below:
- A: The project panel summarizes the current SVA project, including the information on the subjects and the annotation databases, etc.
- B. The pie chart panel provides a brief summay on the functional composition of the SNVs and INDELs identified.
- C. The log panel keeps a track of the tasks performed, and sometimes is used to briefly output analytical results.
- D. The SVA tables separately list annotated single nucleotide variants (SNVs), INDELs, and structural variants (SVs). These tables also respond to different filters that the users may apply.
- E. The SVA genome browser graphically displays genomic features and identified variants, and allows the user to interact with these data for more details or navigating to external resources.
- F. A variant density overview across the genome.
- G. Status bars display the current status of the program and the currently active SVA table.
| Visits: |
© 2011
© 2011